We recently conducted our annual User Survey – many thanks to all our users who participated. We use the survey to gather valuable insight into our users’ experience with BioSolve, and it often leads to product improvements and enhancements based on user feedback.
Overall, responses to the survey were overwhelmingly positive, although we did take on board some ideas for improvement as well.
To begin with, we would like to share two comments from users who were responding to being asked what they most like about BioSolve Process, both of which reflect some of the key benefits of the product:
- “Ability to look at end to end processing and evaluate impact of different technologies on the end to end process.” – David Pollard, Exec Director, Biologics New & Enabling Technologies, Merck US
- “It’s easily configurable, is in a familiar format (excel), can be quickly exported out to .ppt or .xls to share with others. Calculations and assumptions are relatively transparent.” – John Higgins, Associate Director of Technology Transfer & Process Validation, Novavax US
We received many other positive comments, featuring words and phrases such as:
- “Familiar to use”
- “Ability to understand the calculations (no black box)”
- “Configurability”
- “Visual element”
- “Level of detail”
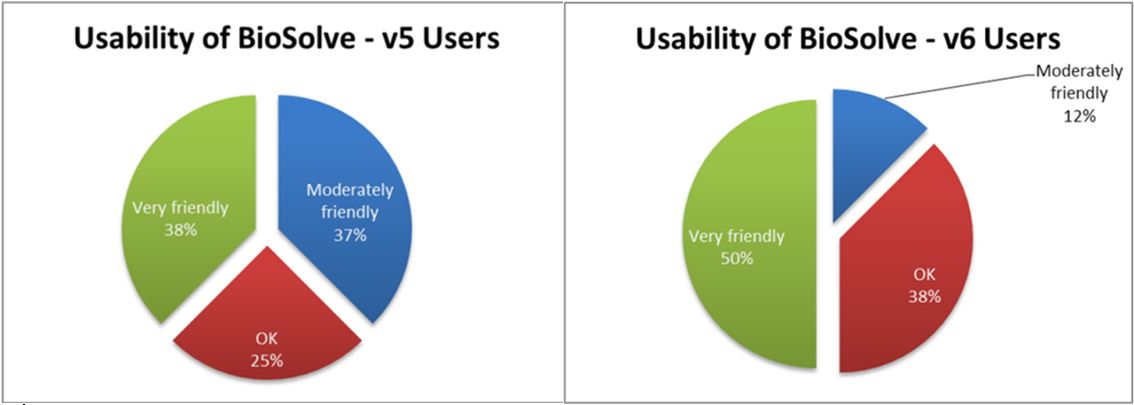
Usability
When we look at the usability of BioSolve, the majority of users reported that they find the product to be “friendly” to use. And it was interesting to note that those who said “Very friendly” increased from BioSolve Process v5 to v6, which indicates that our recent upgrades, such as the customisable dashboard, have contributed towards improving product usability.
Requested features
When we started to look in deeper for most requested features, we found that the features most people wanted to see included in BioSolve are “easier equation building” and “customisable reports”.
Another request was to be able to get a more detailed breakdown for the comparison analysis. We recognise the importance of our users’ feedback in this area and are actively considering these elements in our development program. Watch this space for future announcements!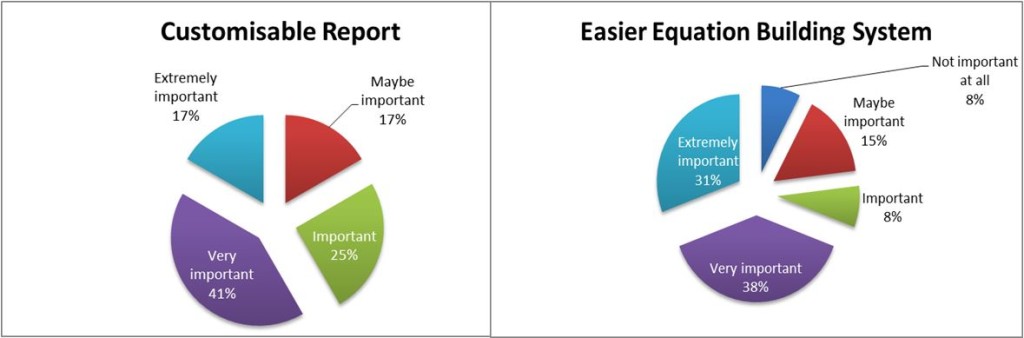
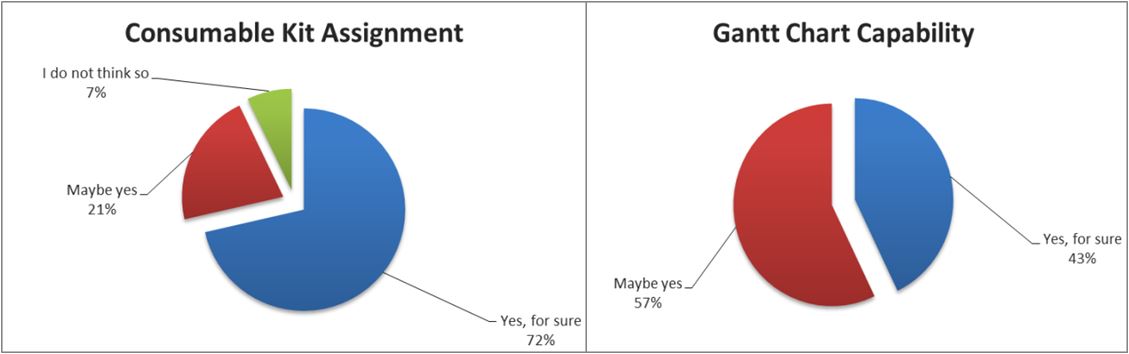
Consumable Kit vs Gantt Chart
For our forthcoming releases, we wanted to know how much our users were interested in consumable kit and Gantt chart capabilities. From the survey, it is clear that consumable management is a clear winner – reflecting the strong interest in Single-Use applications among our user base.
But we are sure that our users will also be delighted with the upcoming Gantt chart capability, which will allow clear visualisation of multi batch operations and configuration in terms of seed train and bioreactor pooling. Importantly, the Gantt chart will be the base functionality to track vessel and bag allocation in future.